Personal income rose in 2011 in all of the nation’s 366 metropolitan statistical areas for the first time since 2007, according to estimates released today by the U.S. Bureau of Economic Analysis. When adjusted for inflation however, 44 metros actually experienced income loss [1]. Leading the pack were the Odessa and Midland metros, both in Texas, showing the highest year to year growth at 8.9 and 8.4 percent, respectively. Per capita personal income for metropolitan areas as a whole increased by 1.1 percent.
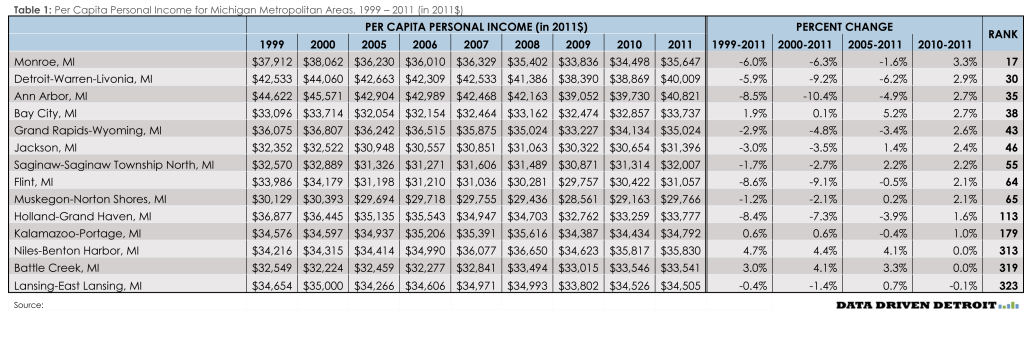
The Michigan story is what is most interesting in the new data. Eleven out of our 14 metropolitan areas showed strong year to year income growth between 2010 and 2011 (see details in Table 1). Southeast Michigan took the lead with Monroe, Detroit and Ann Arbor at the top, followed closely by Bay City and Grand Rapids leading the charge. Each of these areas saw income grow by more than 2.5 percent. For all but Bay City, this growth represents a trend that just started one year previous (2009-2010). Ann Arbor and Detroit continue to be significantly below their recent high water mark in 2000, while Bay City has remained relatively consistent over the decade. Jackson, Saginaw, Flint, and Muskegon also saw their incomes grow by at least 2 percent.
When was the last time that Michigan could brag that we had 9 metros in the Top 65, with Monroe in the Top 20, and Detroit, Ann Arbor and Bay City in the Top 40?
While Holland regained some of its decade losses with a 1.6 percent gain, Niles-Benton Harbor, Battle Creek and Lansing were stagnant.
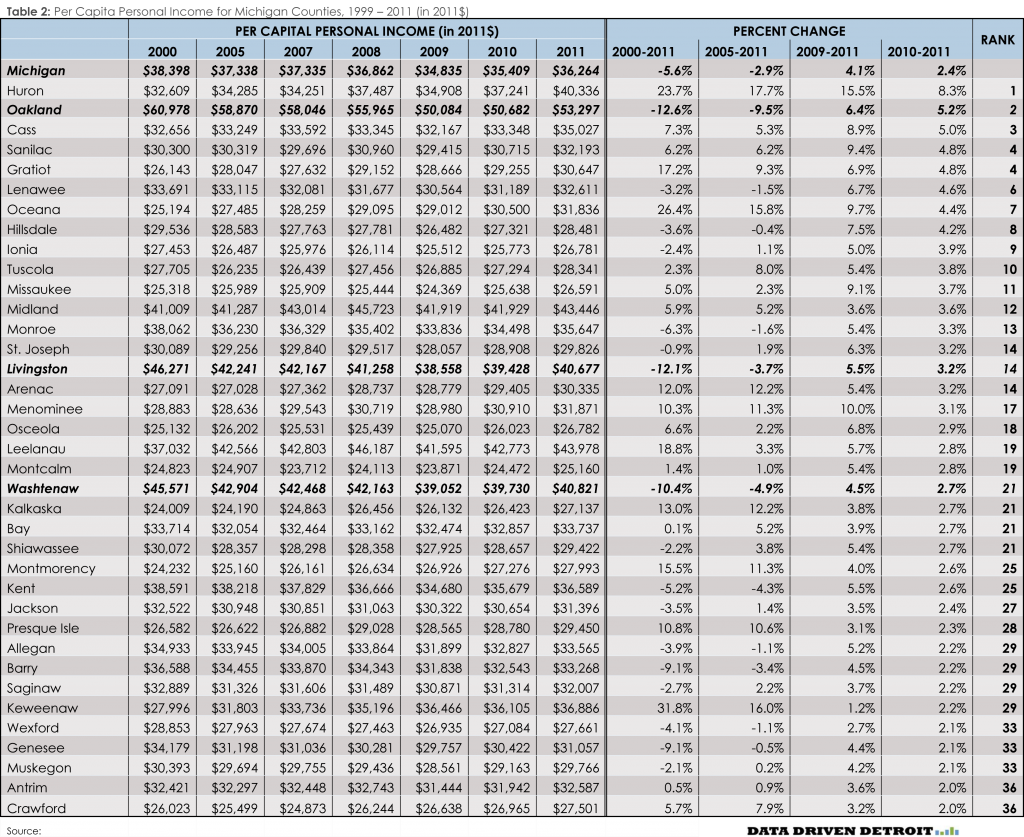
The good news continued at the county level where 73 counties experienced income growth; two experienced no change; and only 8 experienced a decrease. Of these eight counties, six were in the Upper Peninsula, while the other two – Eaton and Ingham – were in the Lansing-East Lansing metropolitan area. Table 2 shows the ranking of Michigan counties with income gains of at least 2 percent, 2010-2011.
[1] While the BEA release calculates change based on current dollars, the current analysis is based on 2011 adjusted dollars for all years discussed.


