Have you had a chance to explore State of the Detroit Child 2.0? This data tool provides several great features for getting the data that can answer your questions about children, families, and education in Michigan.
Critical Questions
Not sure what kind of data this tool provides, or where to begin your search? Get started with the Critical Questions feature, which provides quick answers to common questions about children in Detroit and gives an idea of the types of questions that SDC can answer.
This section is displayed by default when you first visit sdc.datadrivendetroit.org, and it can be visited again from other sections by clicking on the “Critical Questions” button.
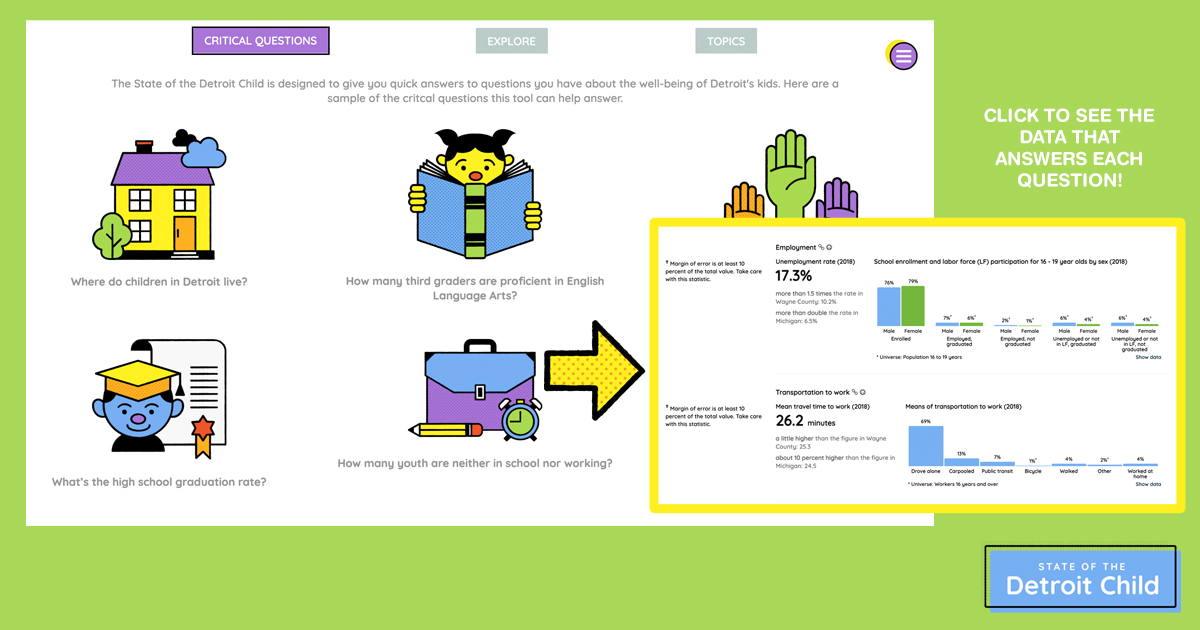
Each of the six questions on this page directly links to a map, table, or set of graphs that provides the data to answer that question—and may even be a good starting point for answering other questions you have.
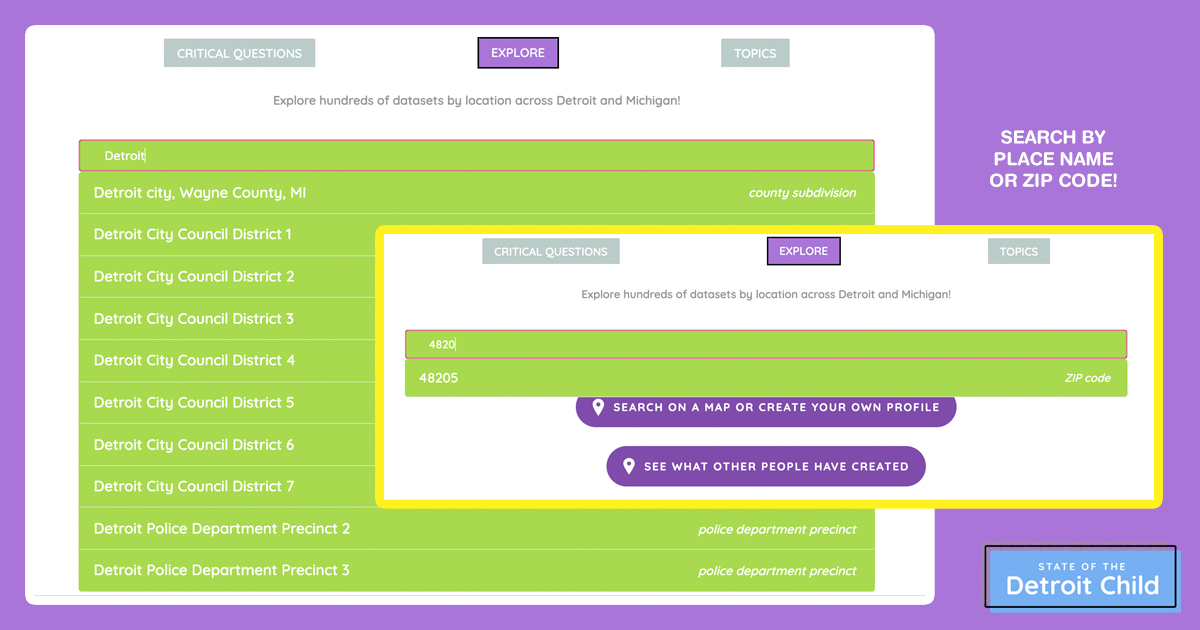
Using the green search bar, you can easily search by ZIP code or by Michigan place, such as city or county, or Detroit police precincts or city council districts. Just type in your desired Michigan place, by name or by ZIP code, and click on the best match that comes up on the dropdown menu below the search bar.
That will take you to that location’s profile page, where you can see a map with basic demographics, and scroll down to view a number of data related to youth, families, and education.
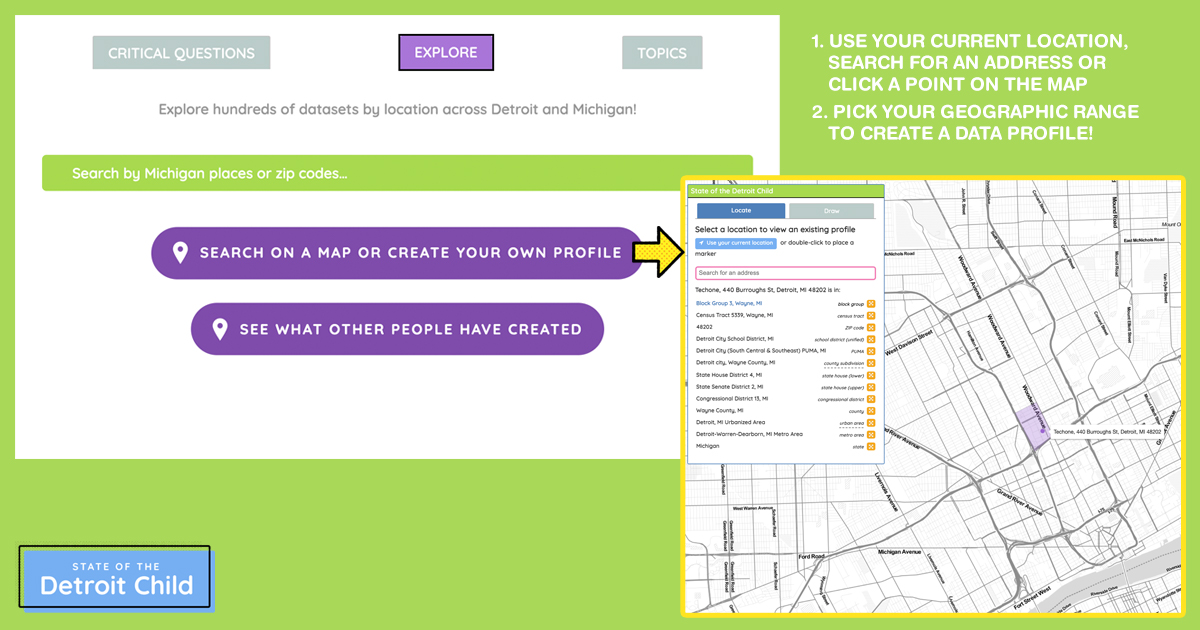
From the map screen, you can use the “Locate” tab on the menu in the upper left corner to establish a geography based on a specific address in one of three ways:
- Click the “Use your current location” button
- Click and drag to navigate to a desired area on the map and doubleclick a point
- Type in the address in the “Search for an address” bar
Once you’ve picked your location in one of these ways, select a geography from the dropdown menu, such as census tract, school district, or ZIP code, to generate a profile page. Census tract is typically the smallest geography.
Then a data profile for the area you selected is generated. From this page, you can review a map and basic demographics for your location, and scroll down to see youth-centric data.
Explore: Draw a Custom Geography
If you’re looking for information related to a neighborhood or an area that encompasses several specific locations, try using the Draw feature to create a custom profile for your unique geography.
From the map screen, click the “Draw” tab on the menu in the upper left corner to begin drawing your shape.
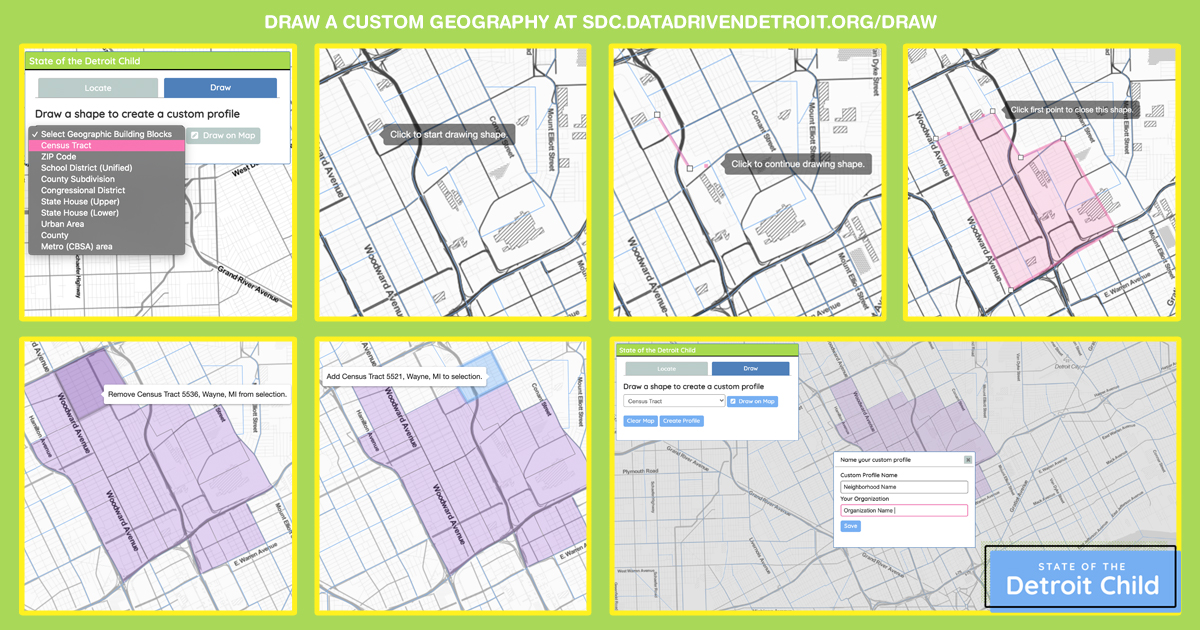
Start by picking your geographic building blocks from the dropdown menu—census tract is typically the smallest one for highly local data—and then click the “Draw on Map” button immediately next to it.
From here, you can click and drag to scroll around the map to find your starting point. Click a point to begin drawing your shape. Click additional points to create a polygon shape over the map, and then click on your first point again to close the shape.
The SDC tool will create an area made up of the geographic building blocks you selected. If the area is too big or too small, you can click on surrounding blocks to add or remove them from your geography.
Once you’re happy with your shape, click “Create Profile” from the menu, and then type in a name and your or your organization’s name in the pop-up box, and click “Save.”
This generates a profile page of your custom area with a map at the top, where you can scroll down to see the data available for that area.
Explore: See What Other People Have Created
Many people are looking for data about education and child welfare in their community. There could already be a data profile for your geographic area of interest saved in the State of the Detroit Child tool!
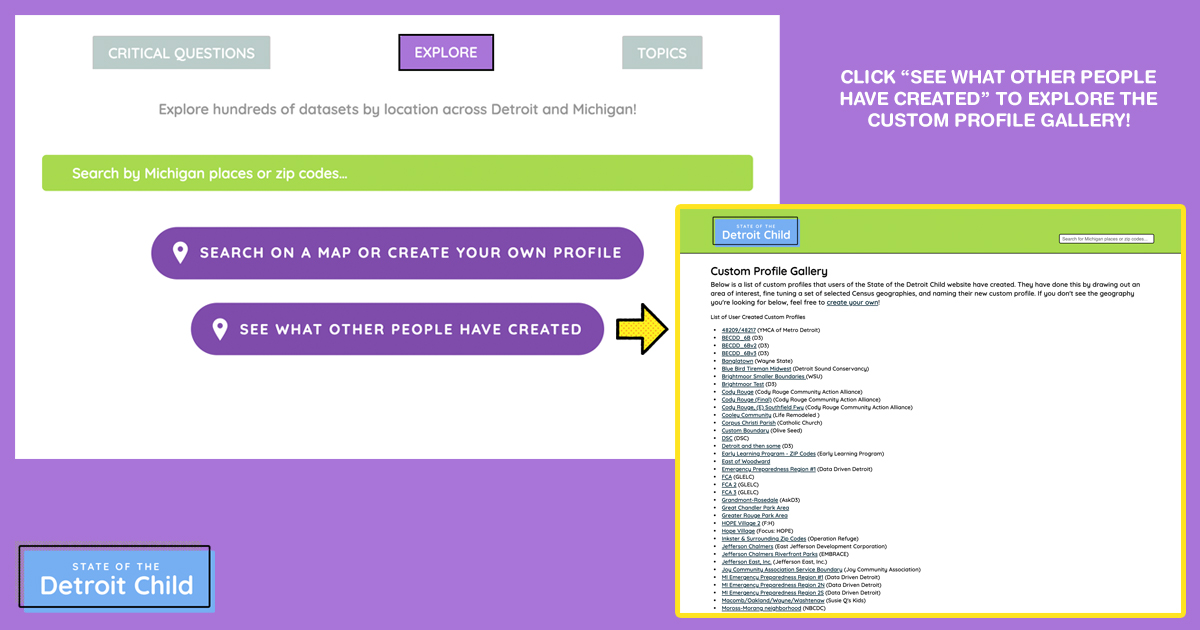
Check out profile pages that users have created already, or easily find a profile that you or another member of your organization has made, by clicking “See What Other People Have Created” under SDC’s Explore tab.
This opens up a page that lists all saved profile pages in alphabetical order. You can click on any that look relevant to your organization to open the profile page, where the data can be accessed.
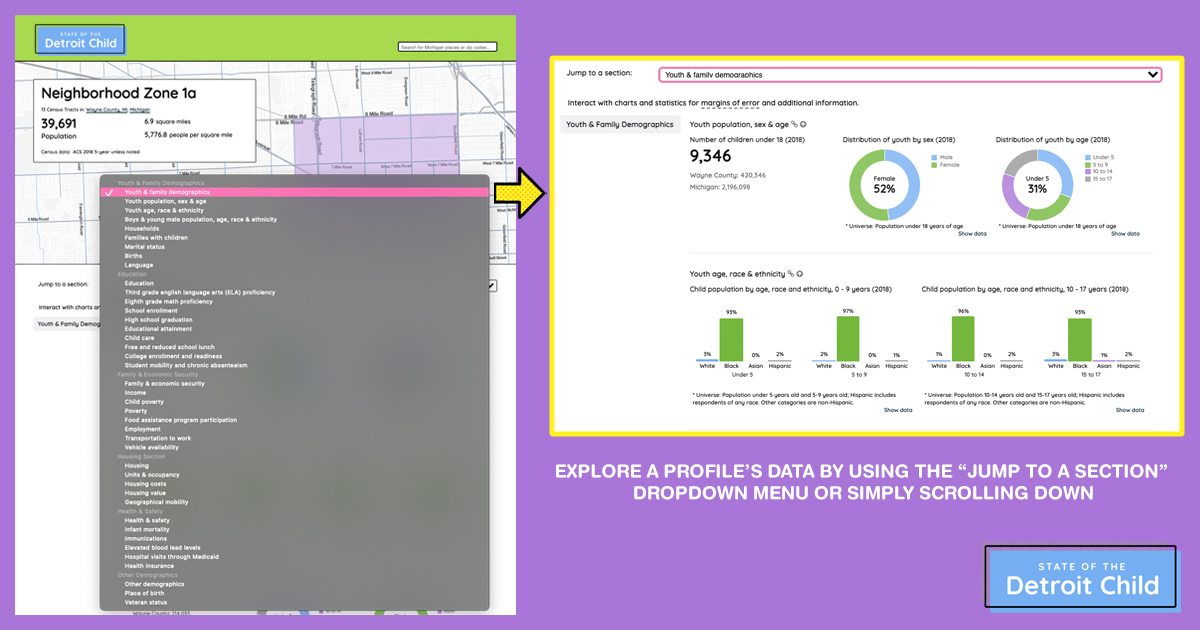
Navigating this data is as easy as scrolling down the page, or using the drop down menu under the map on the top of the page to jump to your desired information topic.
For more detailed numbers, click the “Show data” link at the bottom of a graph. Each section header also has a permalink icon and a back to top icon next to it for easy navigation.
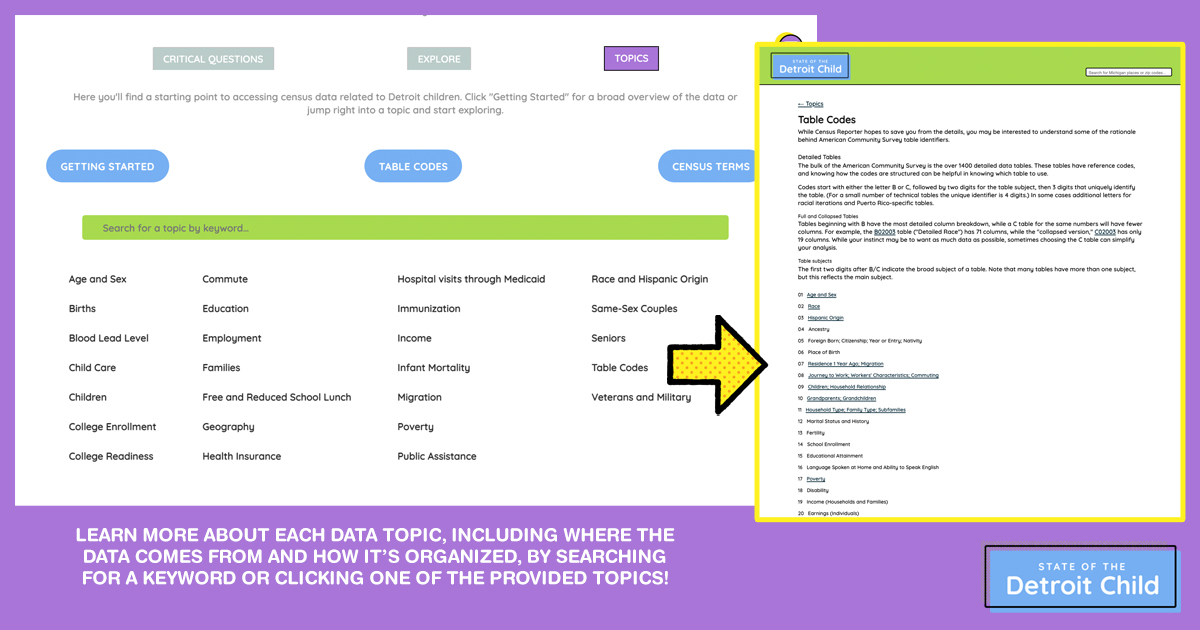
You can view definitions for various data topics, search for keywords related to your topic of interest, and view an online glossary of Census terms. Each topic link leads to a more detailed page that provides information such as where the data comes from and how it’s organized and used.
Now that you’ve taken time to learn all of the great ways that you can find and use data in our State of the Detroit Child tool, you’re ready to dive in! Click here to start exploring.
Looking for a handy cheat sheet for using the State of the Detroit Child tool? Download our one-page tutorial PDF! And if you have additional questions about how to best navigate this tool, or have other data questions, you can AskD3.
