Sometimes data can feel a little distant, like it’s just numbers and charts. But we at Data Driven Detroit (D3) know that behind every data point is a real person, so data is really about people and their lives. That’s why we decided we had to do more than just put our Neighborhood Vitality Index (NVI) online. We wanted to meet people face-to-face and make the data come alive! So, we took our show on the road to the 3rd Annual Collard Green Cook-Off presented by Detroit is Different, and what a day it was. We set up an interactive project to get people thinking and talking about what makes a neighborhood a great place to live, and we learned so much in the process.
Activation
We set up a four-station activity to get people involved.
- Signs displayed datapoints from the NVI survey to help spark conversations and interest.
- An interactive whiteboard invited attendees to write Post-it notes answering “What makes a vital neighborhood?”
- Attendees received NVI Recruitment Cards with key information to review before the quiz station.
- Attendees spun a prize wheel and answered NVI-related questions based on the study card to win a logo tumbler
The final stop was a survey station where people who live in Detroit could take the NVI Community Survey, the foundation of our Neighborhood Vitality Index. This survey is really important because it gives residents a chance to share their own opinions and experiences, adding their voices to the data.
Our Lessons Learned
We had a goal to engage at least 100 people, but we ended up giving out all 100 tumblers and engaging even more people after we ran out. It was a clear sign that people were excited to participate and learn. We are also thrilled to report that more than 200 surveys were completed as a result of the event—far exceeding our expectations and providing a ton of valuable feedback!
While the event was a huge success, we also learned some important lessons for next time. For example, some people had a hard time with the reading-heavy quiz and survey. This taught us that we need to find more creative ways to share information, like using more pictures, videos, or just having more conversations. We also found that during busy times, the survey station got a little crowded, so we’ll need to have more people helping out to make sure everything flows smoothly and nobody has to wait too long.
Overall, it was truly enjoyable to connect with our neighbors, make new friends, talk with residents about what’s important in their lives, and understand more about the people behind the numbers.
Community Feedback Is Key
One of the most interesting parts of the day was hearing what people thought about the data we showed. For example, some people disagreed with the statistic that 75% of people feel safe in their neighborhood, believing the number should be lower. This kind of feedback is incredibly helpful. It reminds us that data is just one part of the story, and the real-life experiences of residents are just as important. Instead of seeing it as a challenge, we used these moments to build trust and encourage people to share more in the survey.
We’ve also had time to review the 119 sticky notes residents placed on our whiteboard about what makes a neighborhood vital. People were excited to share their ideas; a few people listed multiple things! The ideas they shared ranged from things we could easily connect to NVI topics/indicators like “safety” and “beautiful parks.” Others related less directly to an indicator, but told us a different vital story.
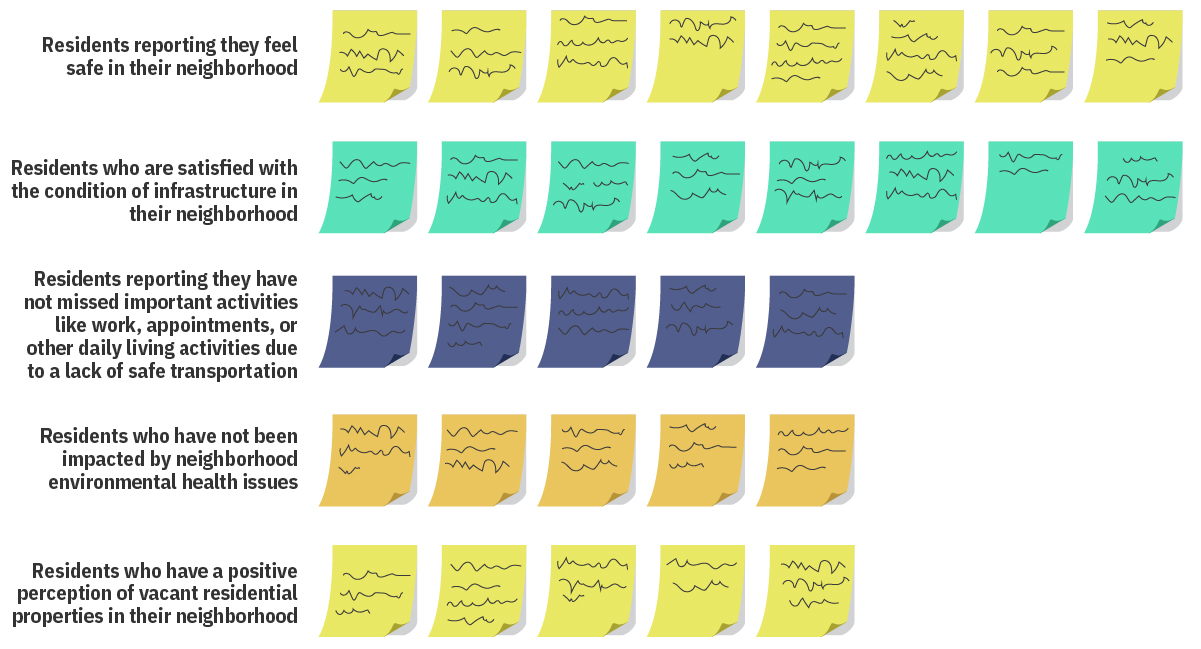
The top NVI indicators we were able to connect sticky notes data to were:

We also noticed that a large number of post-its (46%) were not as quantifiable. The reminder that neighborhood vitality can also look like “community trust,” “everybody working together,” and “love” (mentioned 8 times!) can help D3 continue to remind us of the people behind the data, and help us continue to focus on those voices and experiences as they share their vital perspective. We are also able to start some conversations about indicators that might be missing, such as related to seniors’ quality of life and public services like trash pickup. NVI is an ever-evolving reflection of Detroit residents’ lived experiences. We hope to evolve alongside it in our understanding of those who share their lives with us.
What’s Next?
Our time at the Collard Green Cook-Off was more than just a day of outreach—it was a chance to connect with our community in a real way. We’re already planning to meet with the event organizer to talk about future collaborations, and we’re using all the feedback we gathered to make our next events even better. We’re excited to continue finding new ways to help Detroit residents use data to make their neighborhoods stronger and more vibrant.
Head over to our Neighborhood Vitality Index and explore the data yourself! Take the survey (if it’s open)! Looking for data you can’t find anywhere else? AskD3 for free to get started!
