
Data University
Neighborhood Vitality IndexThe Neighborhood Vitality Index a resource designed by, and created for, residents to improve their neighborhoods. NVI measures what Detroiters care about, like schools, safety, parks, healthcare, and city services.

Housing Information Portal
Geographic Area Tool
High Level Overview
Who
Detroit decision makers and advocates at every level, from community leaders, policymakers, and nonprofit organizations to individuals and families
Where
Detroit geographies, with city council districts and neighborhood zones
How
An annual survey of Detroit residents combined with related public data to paint a picture of the strengths and challenges of Detroit’s neighborhoods
What
Data from annual NVI survey responses weaved together with data from other sources.
Why
For residents and neighborhood organizations advocating for positive change, community development organizations to ensure equitable neighborhood investment, and to guide for policymakers in Detroit that measures more than 60 specific indicators for Detroit neighborhoods
How to Use This Tool
First, visit nvidetroit.org
At the top navigation, click the “Get Data” button to access the Detroit geograpy profile tool.
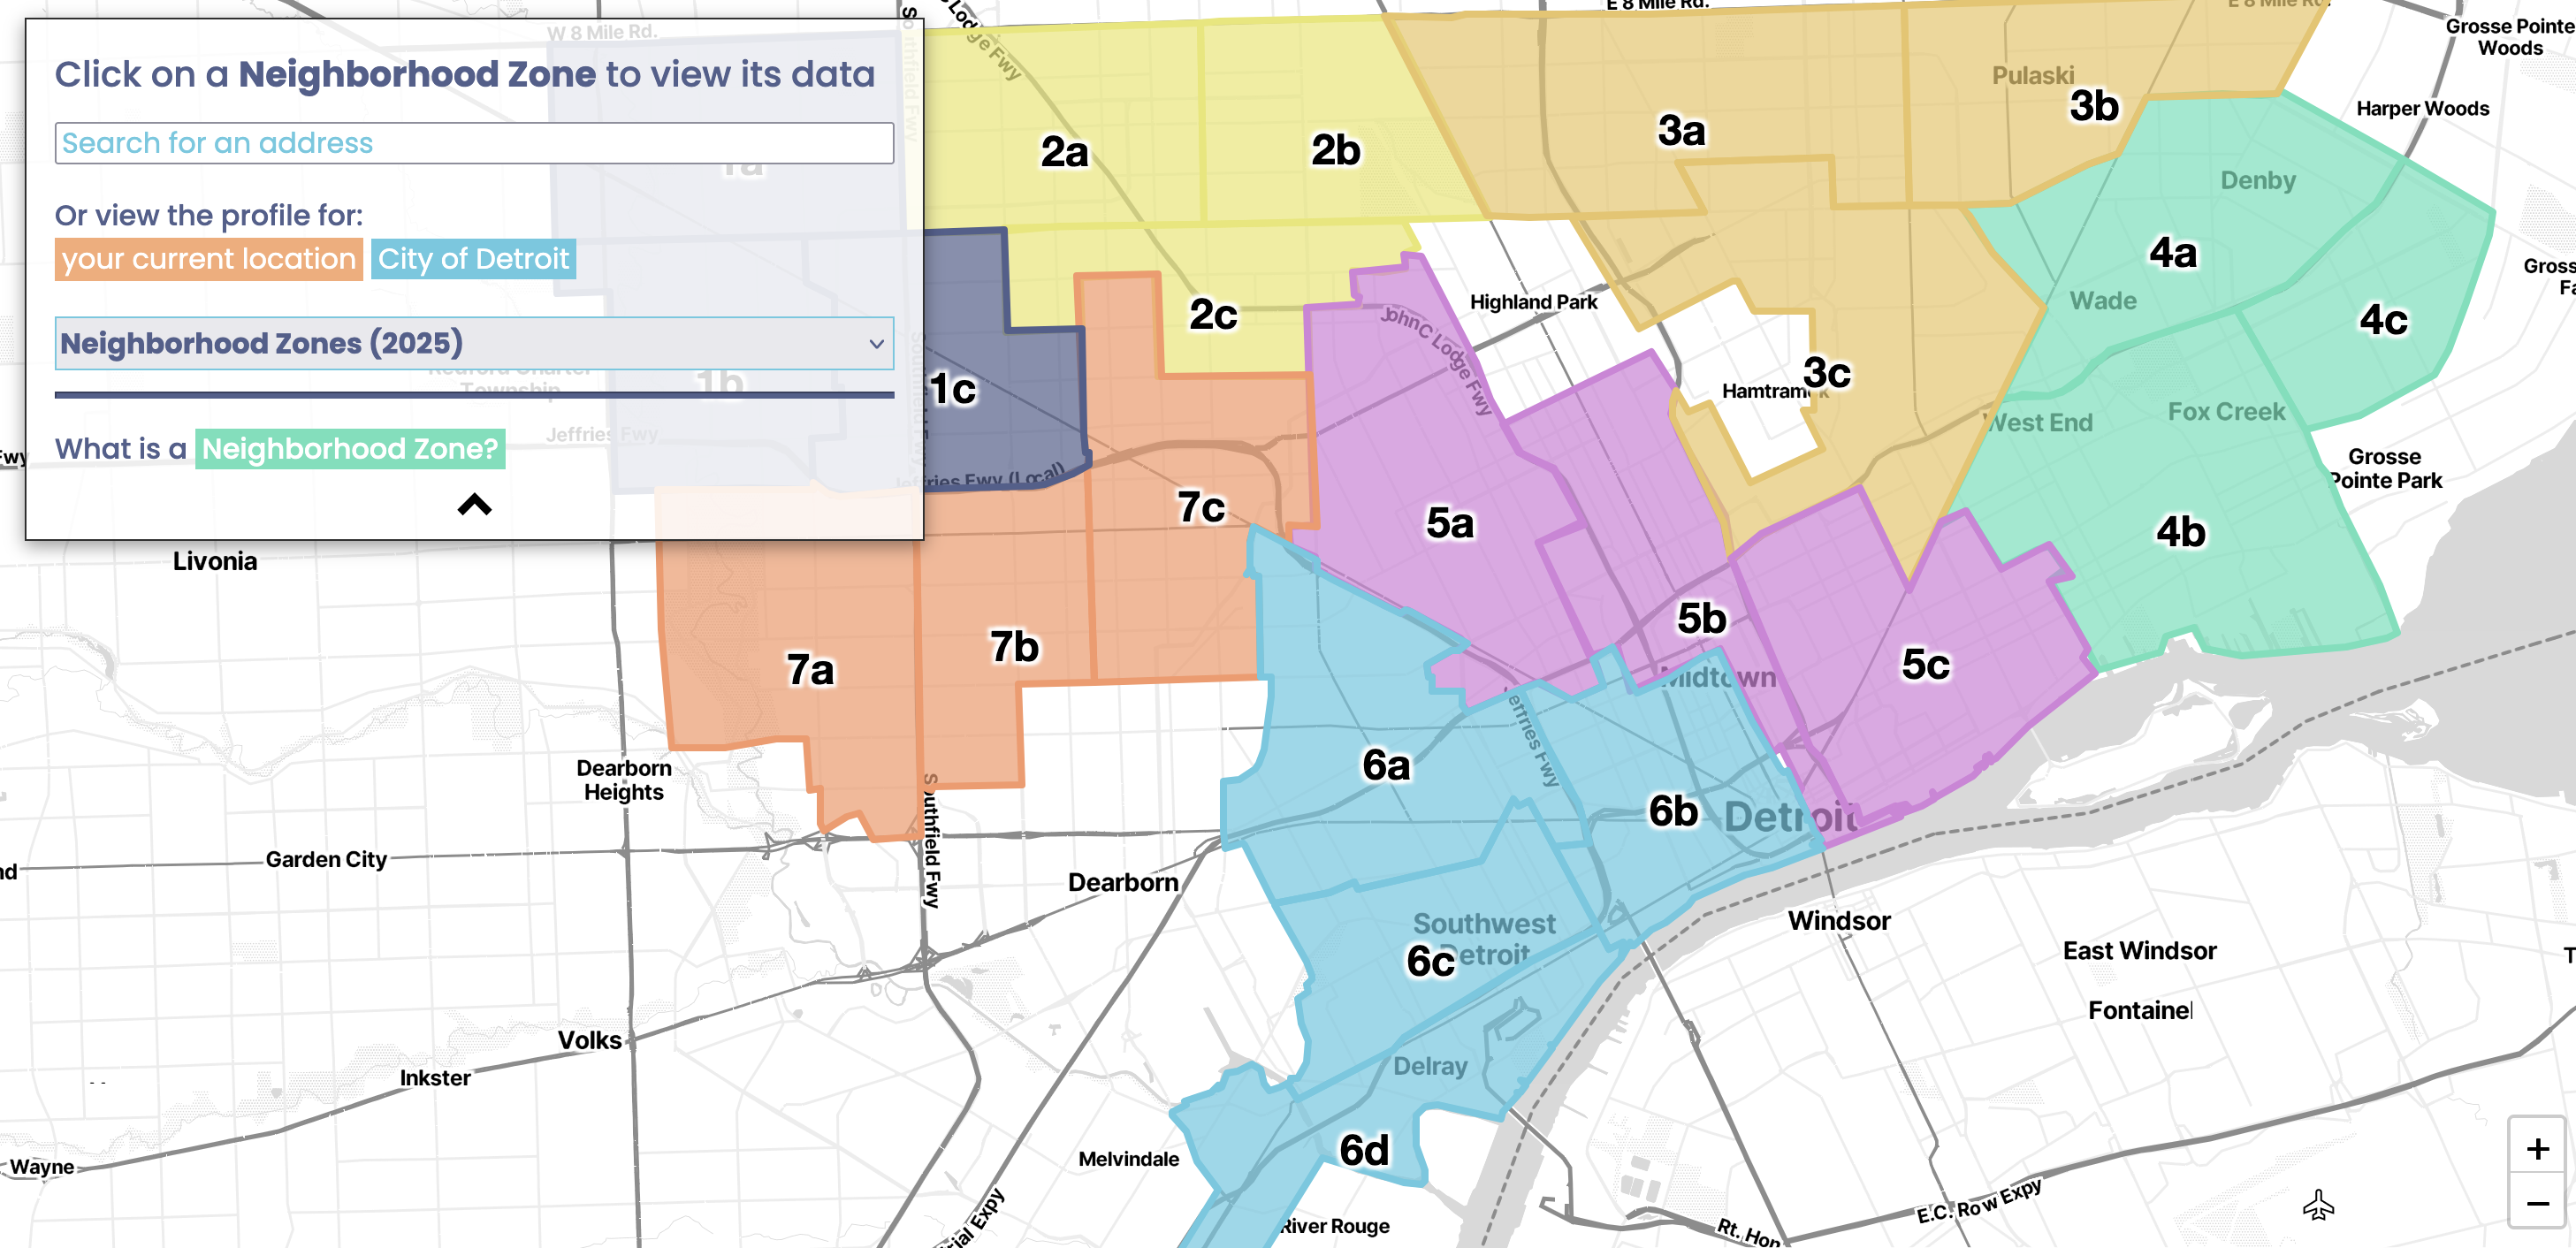
Here is where you select the geographic area you would like to see a data profile about. By default, the map shows neighborhood zones of the most recent data year. If you already know which geographic area you need, you can click that area on the map which geography to go directly to that profile. If not, you can use the box in the top left corner to enter a Detroit address, or click on “your current location” if the area you’d like to see is where you are currently located.
To change the type of geography or data year, select the dropdown menu to switch between city council districts and neighborhood zones, or to change the year of data. If you aren’t sure what neighborhood zones are, you can click the “What is a Neighborhood Zone?” button to read an explanation. Click the “City of Detroit” button will show you a data profile of the entire city.
Exploring the geographic profile page:
1) Context Indicators:
The first data on the profile page grounds you with general information about the geographic area you selected, like total population, people per square mile, home ownership rate, and land use.
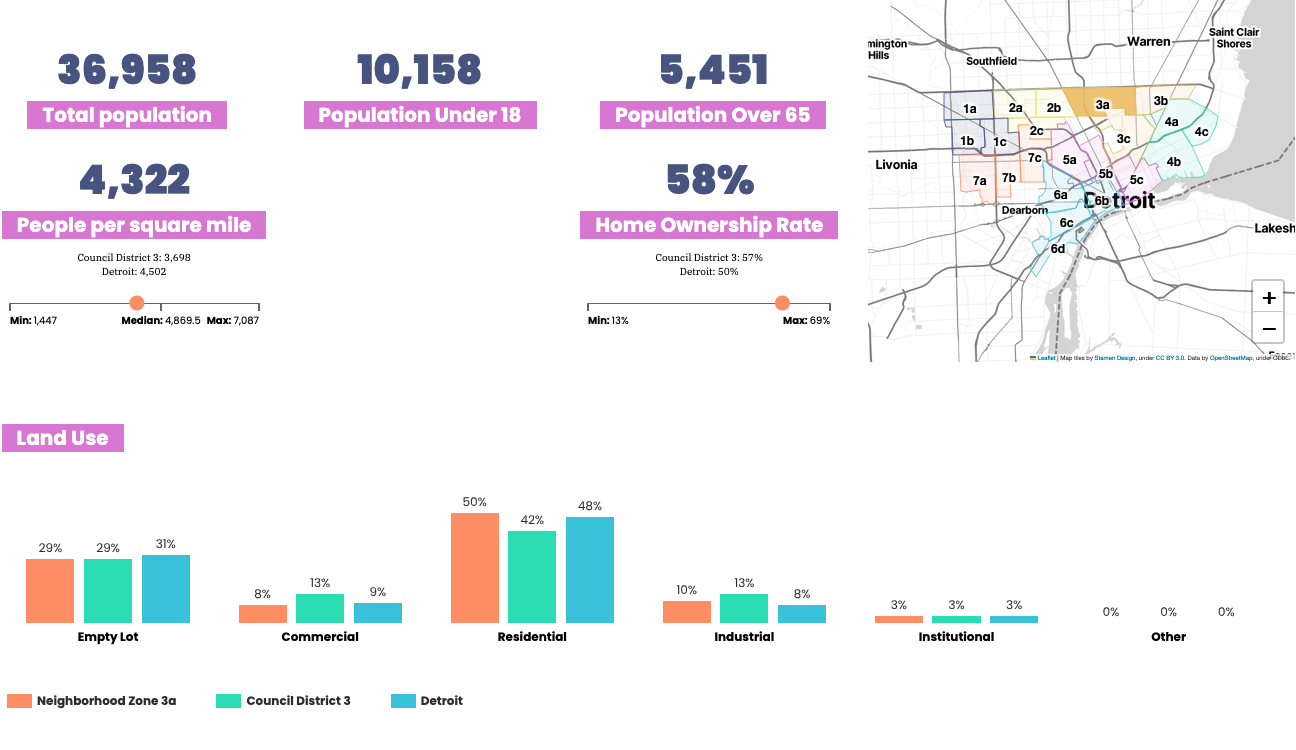
2) Background information:
Before you get into the NVI data, if you want to understand how the indicators are calculated and the history of the project, click on the Go to Methodology button. If you’d like to have descriptions about each indicator and its source as you go, click the Data Descriptions button.

3) Strenghts and opportunities:
To prime you with quick, notable indicators before seeing all 60+ indicators, you’ll see four indicators that represent areas where your selected geography is doing particularly well based on survey responses. You’ll also see four more indicators where you selected geography has opportunities for action.
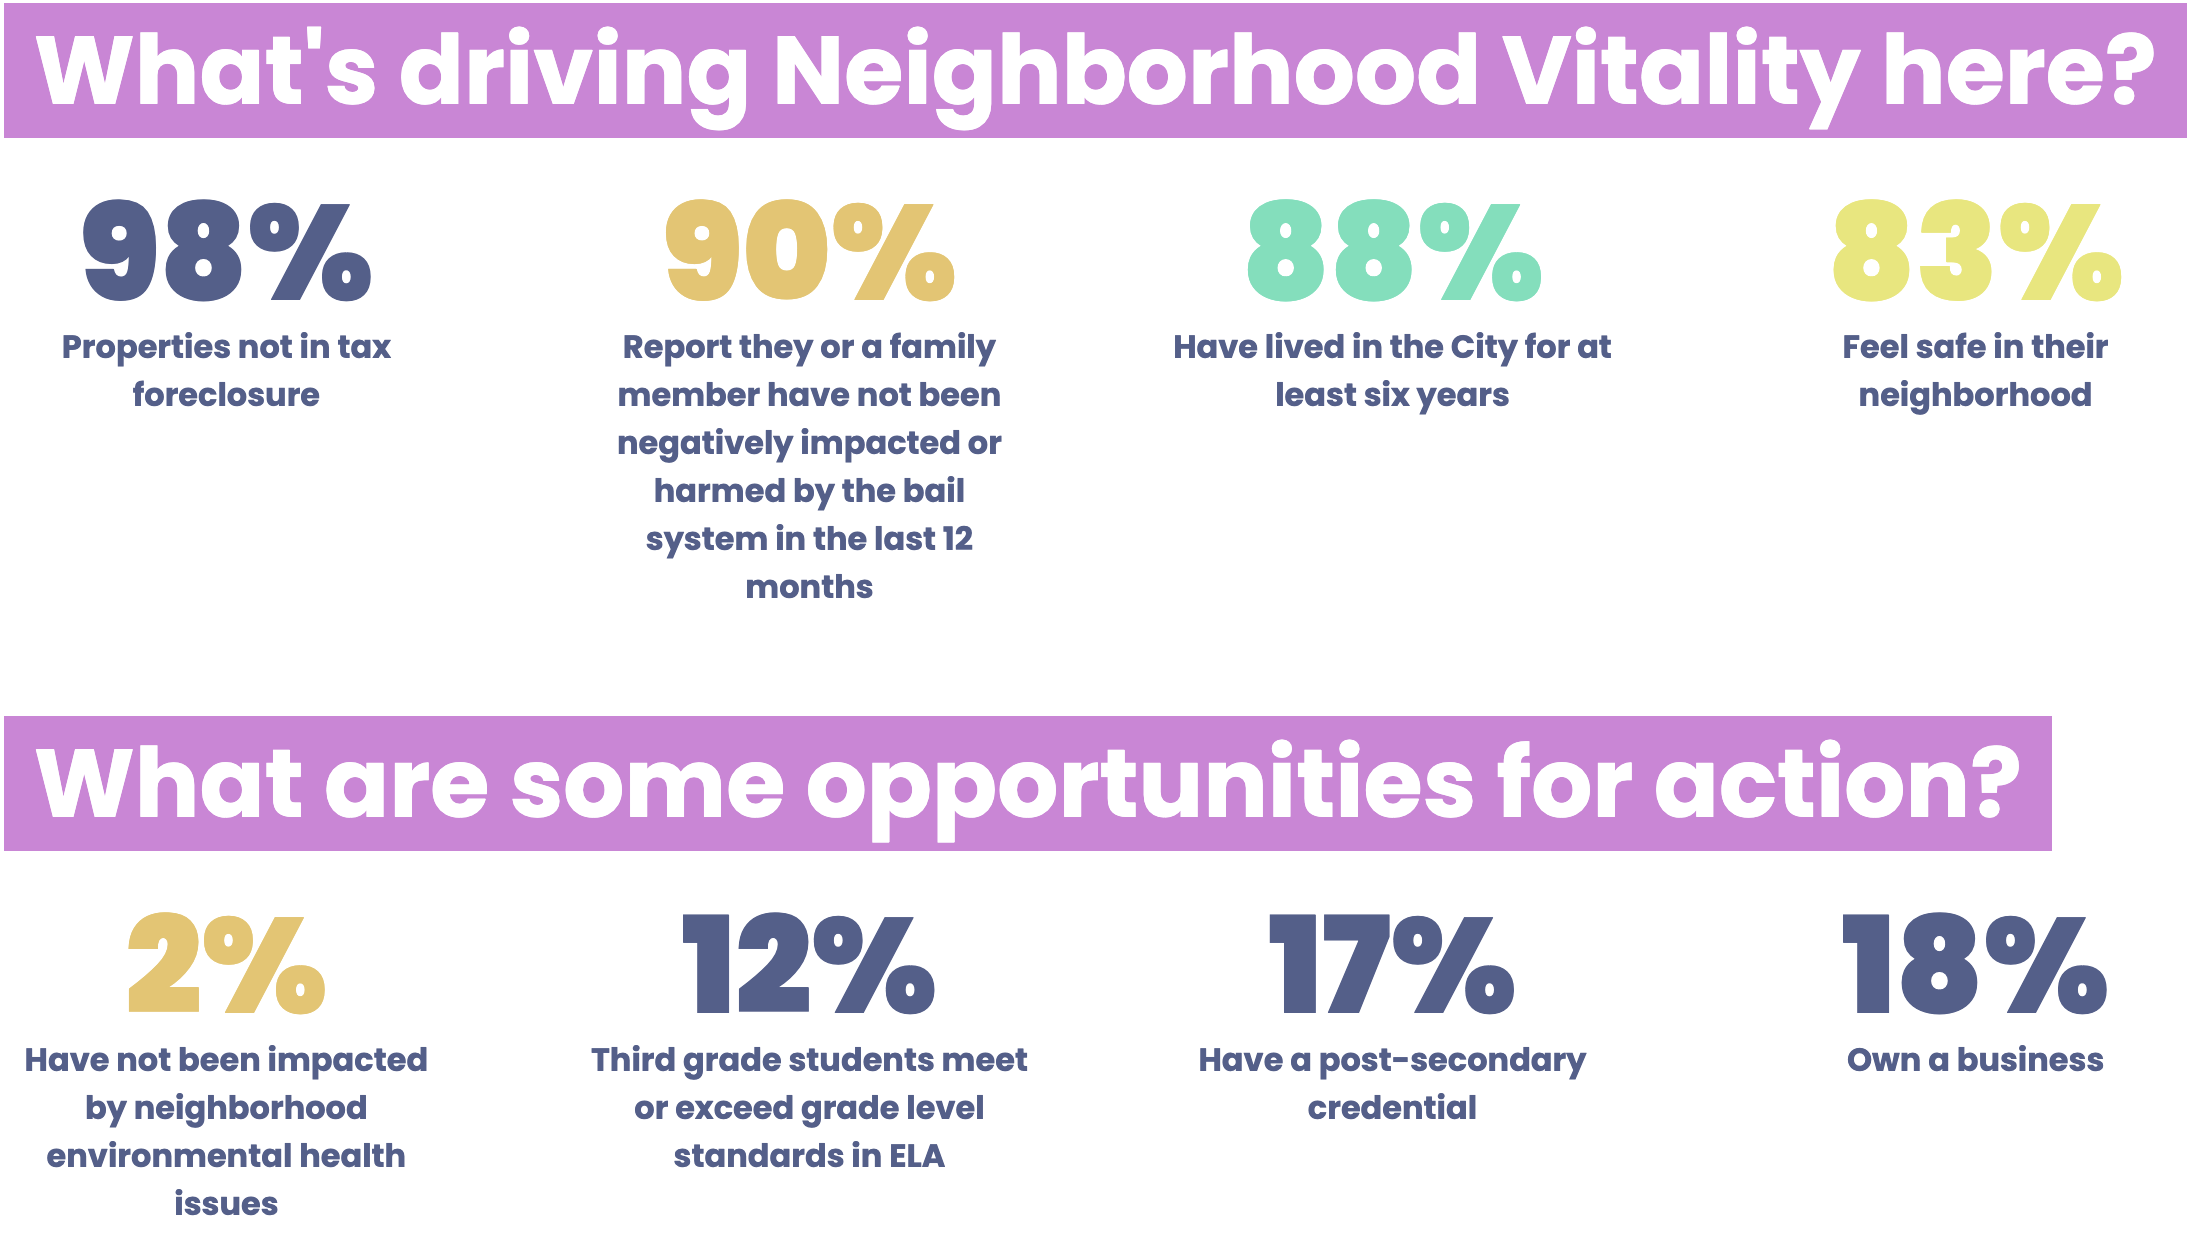
4) The indicators:
Here is wher you’ll find the main part of the NVI: the survey indicators and public data. The profile has only the “Community Capacity” section open to keep the page from overwhelming you with the indicators from all seven categories.
In the category you’ll see the indicators from the survey listed above a slider of more context indicators related to that particular category. You can use the left/right arrows or scroll to see all of the indicators in the slider.
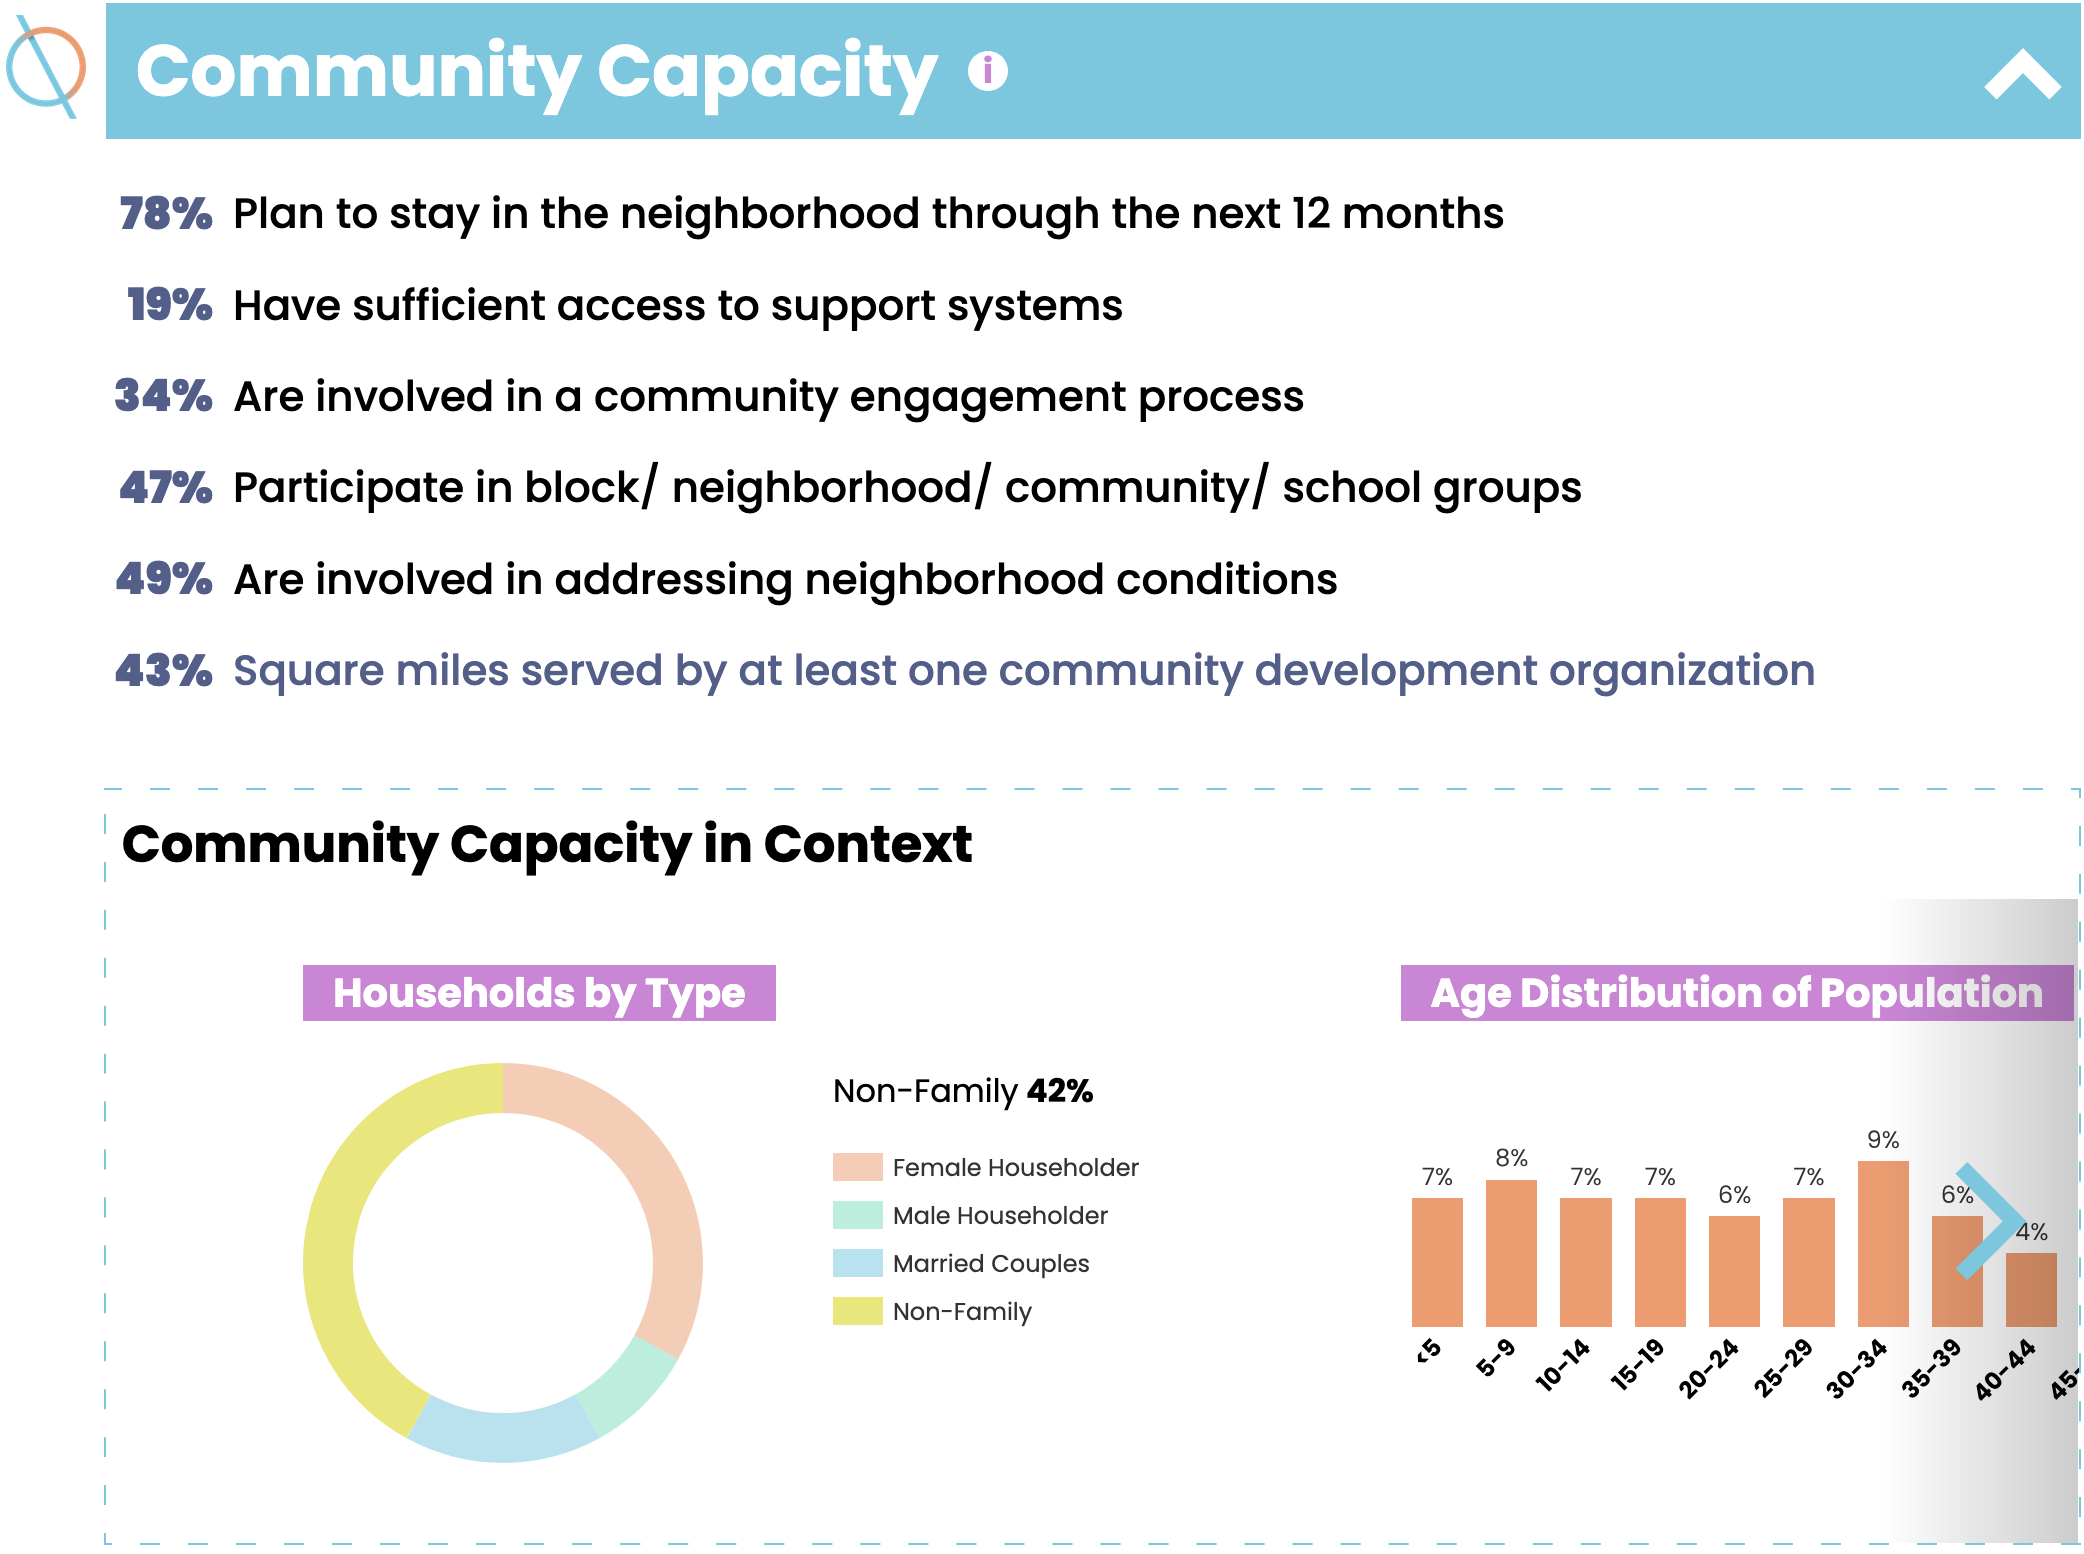
To see the indicators in the other categories, click the up/down arrow to expand or contract the sections. You can have as many open or closed as you like.
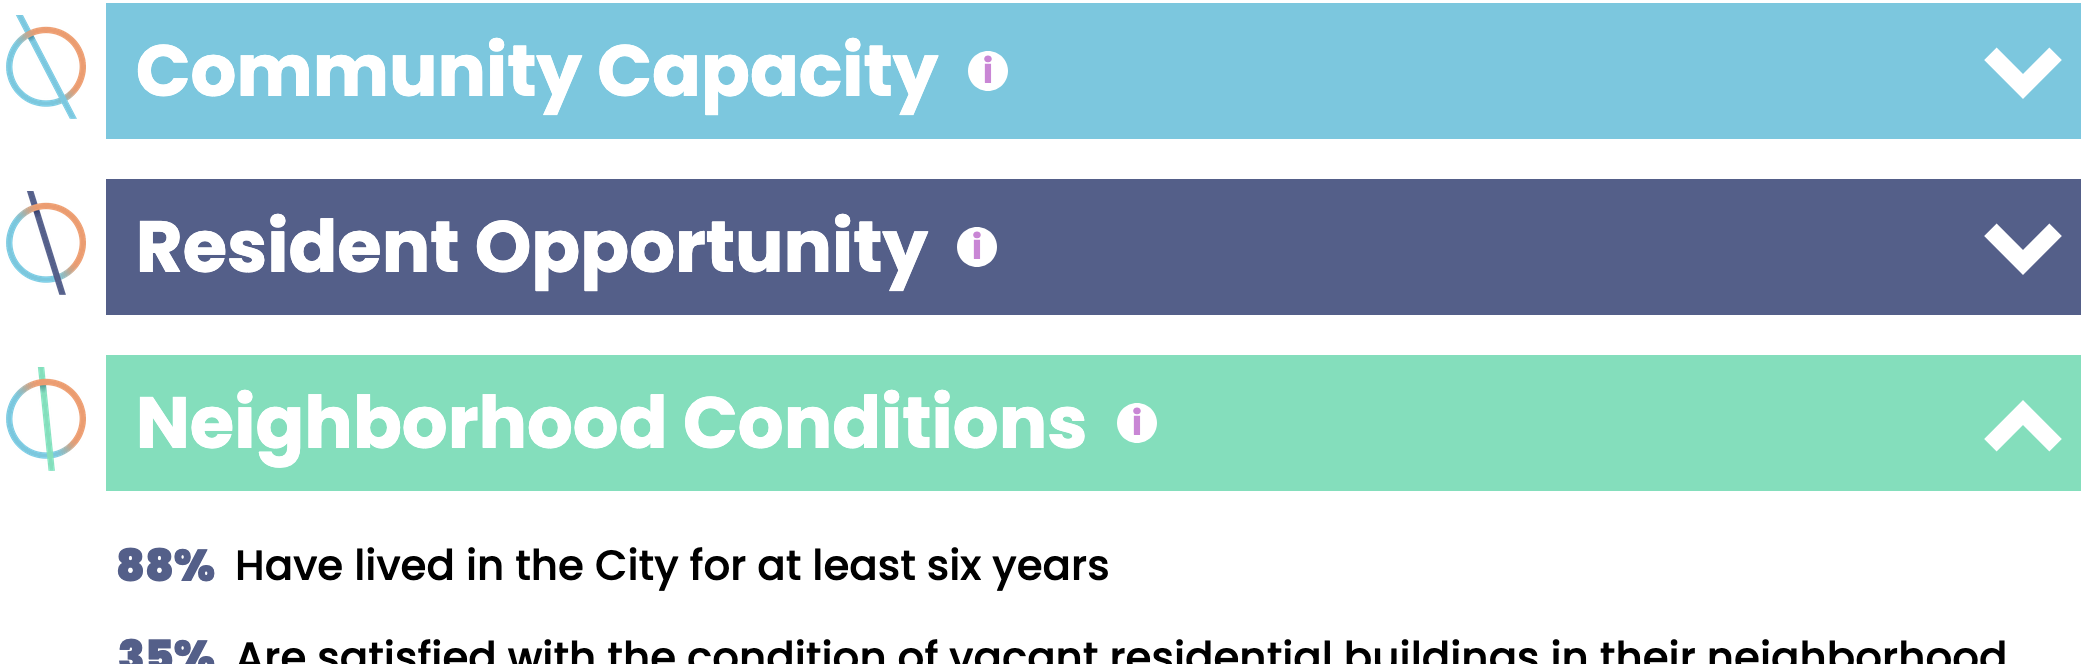
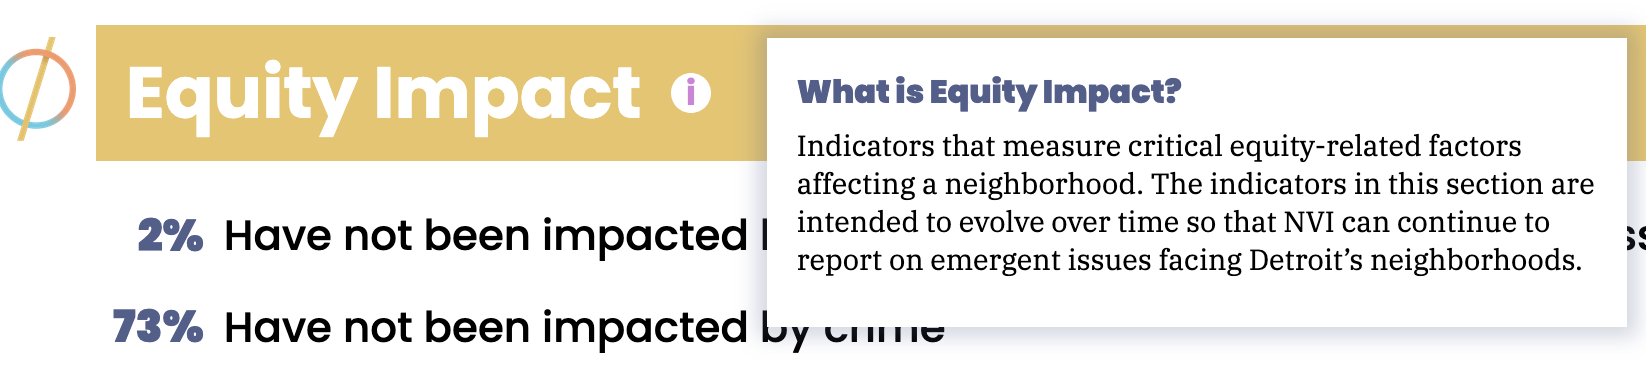
Click on the pink i in the circle to read an explanation of the category to help you find the most relevant category of data for your uses.
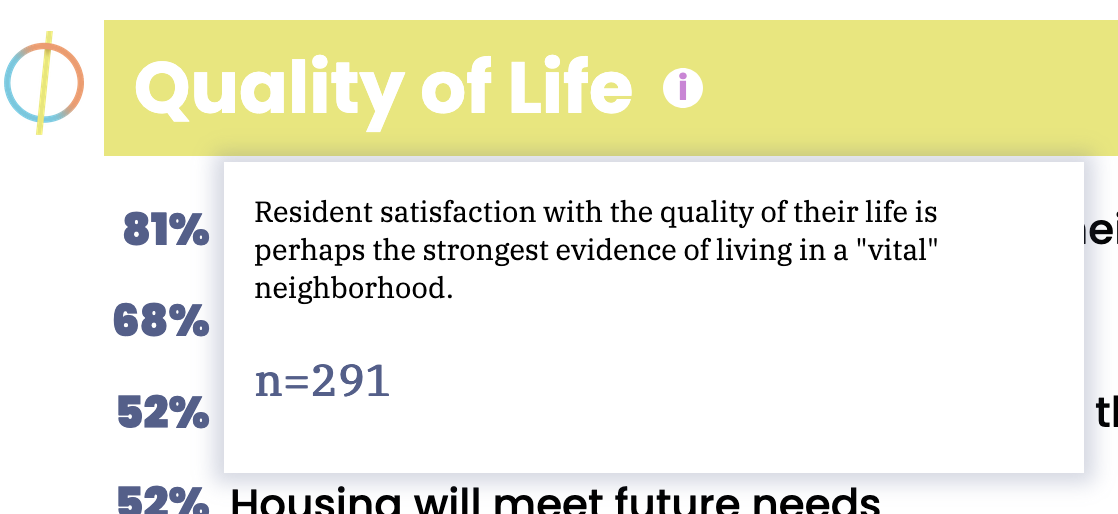
If you’re curious why an indicator is important, you can lick the indicator value to get a pop up with an explanation. You’ll also find an n number that tells you how many people responded to that survey question in your geography that makes up the calculated result. This is important because not all questions are relevant to every survey respondent.
From here, you’ll be able to utilize the entire profile page!
Try exploring other profiles, look at your geography over the years, and make sure to fill out the survey when it’s live!
Now you have the basics, it’s time to exlore!
D3's Co.Lab
Co.act Detroit has partnered with nonprofits and business professionals from Southeast Michigan to offer free virtual consultation appointments with subject matter experts in a variety of fields. Each of our Tuesday Co.Lab sessions is dedicated to a different category of data topics. This allows our attendees to plan and register for the best session for answering their data questions!
Current Schedule
1st Tuesday: Data strategy and Management
2nd Tuesday: Housing and Neighborhoods
3rd Tuesday: Education and Early Childhood
4th Tuesday: Other Data Requests

Just AskD3!
