AskD3 is a free service that we provide to answer questions or requests for data from members of our community. Through this service, we’re able to provide data, analyses, and visualizations to people directly, or to guide them to a source where they can find the information that they’re looking for.
It’s not really surprising that over the years many inquiries sent to AskD3, especially from community advocates and nonprofits, have been about location or population data within specific neighborhoods or geographies in the Detroit area. We’ve found that often the best way to address these requests is to provide the data visually in the form of a map.
From the start of 2020 to now, we’ve had a variety of different geographic data requests that we’ve been able to address with custom-made maps.
Density Maps
Maps using gradient ramps are very useful for giving the reader a way to easily view the density of a population, phenomenon, or regional trend within a geography. Community members who are seeking data can use these maps to identify information such as locations of vulnerable populations, vacancy rates of certain areas, or rates of common life events such as births, vaccinations, or graduations.
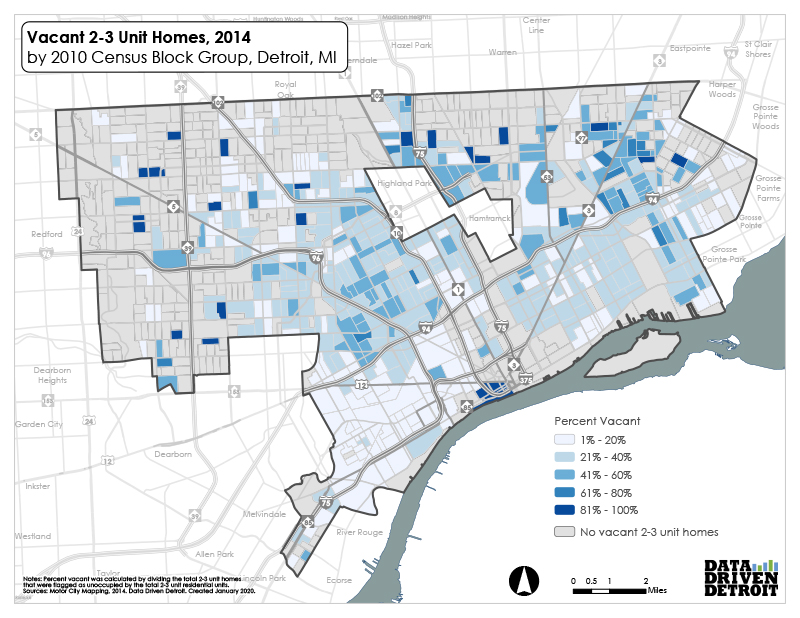
In a January 2020 inquiry, we were asked for the location of all vacant two-family homes in Detroit. One easy solution was to provide a map that showed the density of vacant multifamily housing units by 2010 Census Block Group. This map allowed the requester (or other interested parties) to see the percentage of multifamily homes that are vacant in each part of Detroit.
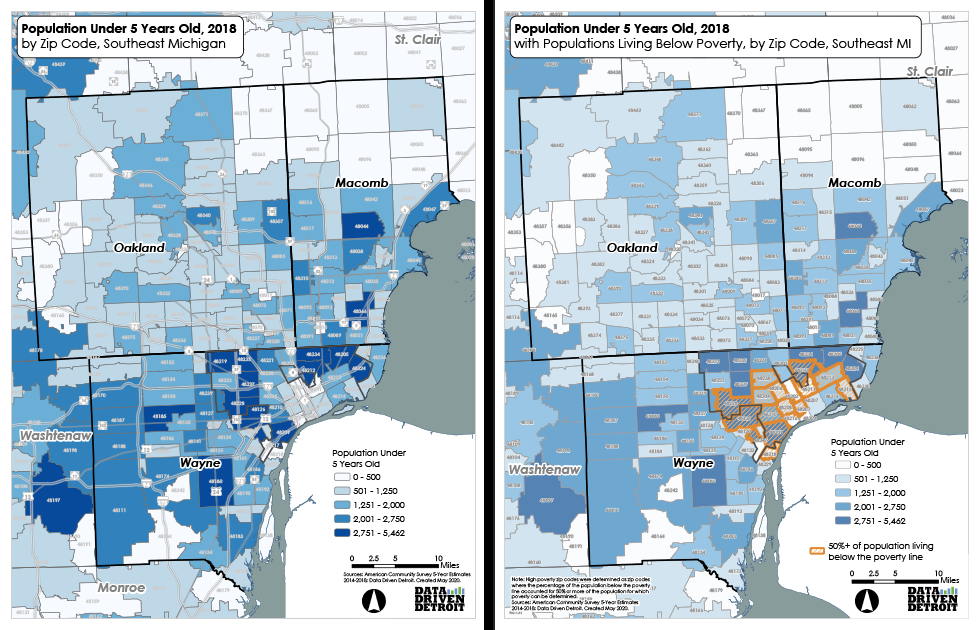
We received a request in June 2020 for help determining where the greatest number of children aged 0-4 were living in the tri-county area, and which of these areas were likely to have the greatest need of expense-reducing services from nonprofit or community organizations. We were able to provide both a map that satisfied the original inquiry and a more detailed version of the map that included an additional request for which of these populations were living in poverty.
Density maps can be particularly useful for showing the number of residents that may be impacted by infrastructure updates during the many stages of community planning. In July, 2020, we were able to provide a member of Transit Riders United with a series of maps that showed SMART bus routes in relation to some key populations that are more likely to utilize public transit—African Americans, people without vehicles, and low-income families.

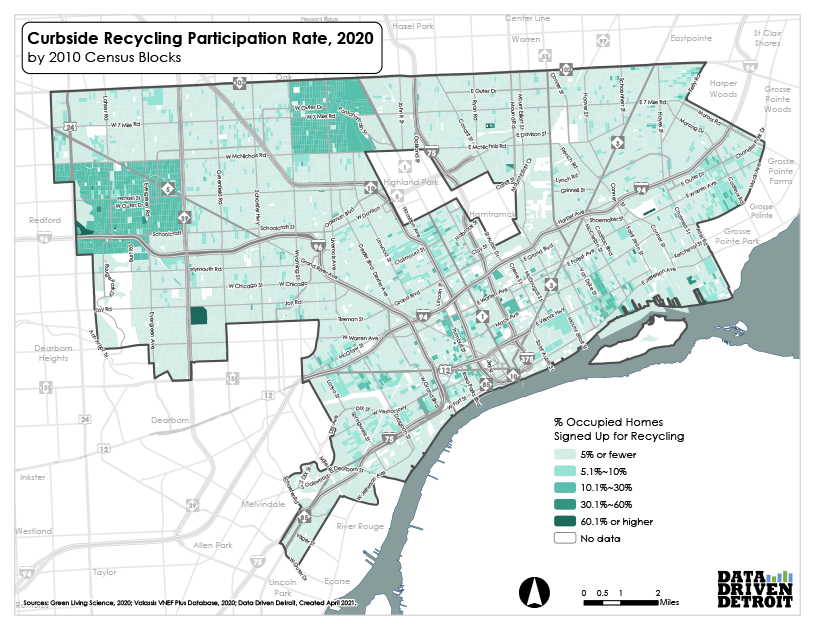
Earlier this year, we received a request for a map that demonstrates the rate of participation in Detroit’s Curbside Recycling program last year. We provided a map that showed the percentage of the occupied homes participating in Curbside Recycling in 2020 by 2010 Census Block.
Location Maps
Many maps feature precise geographic locations, and are useful for showing the reader exactly where specific buildings or people are located. These maps can help with initiatives like planning for community development or infrastructure projects.
In February 2020, we received a request for the locations of charter schools throughout Detroit. We gathered location data for charter schools located in Detroit and the nearby vicinity (as of Fall 2019), and provided these files to the requester for their use in Google Earth and ArcGIS mapping software.
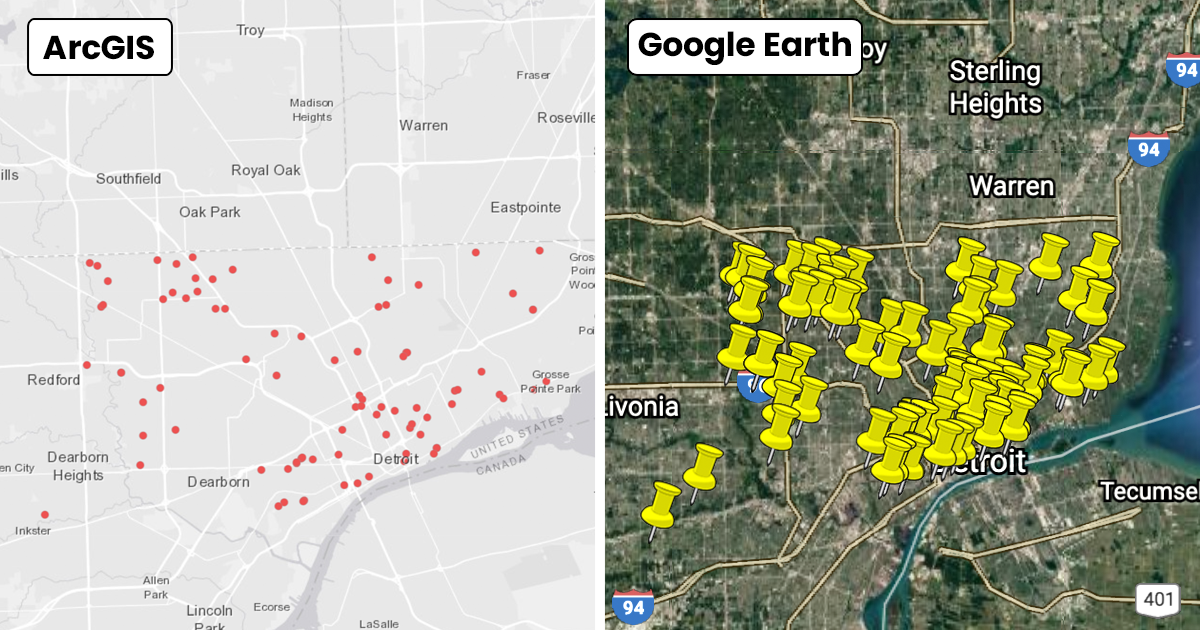
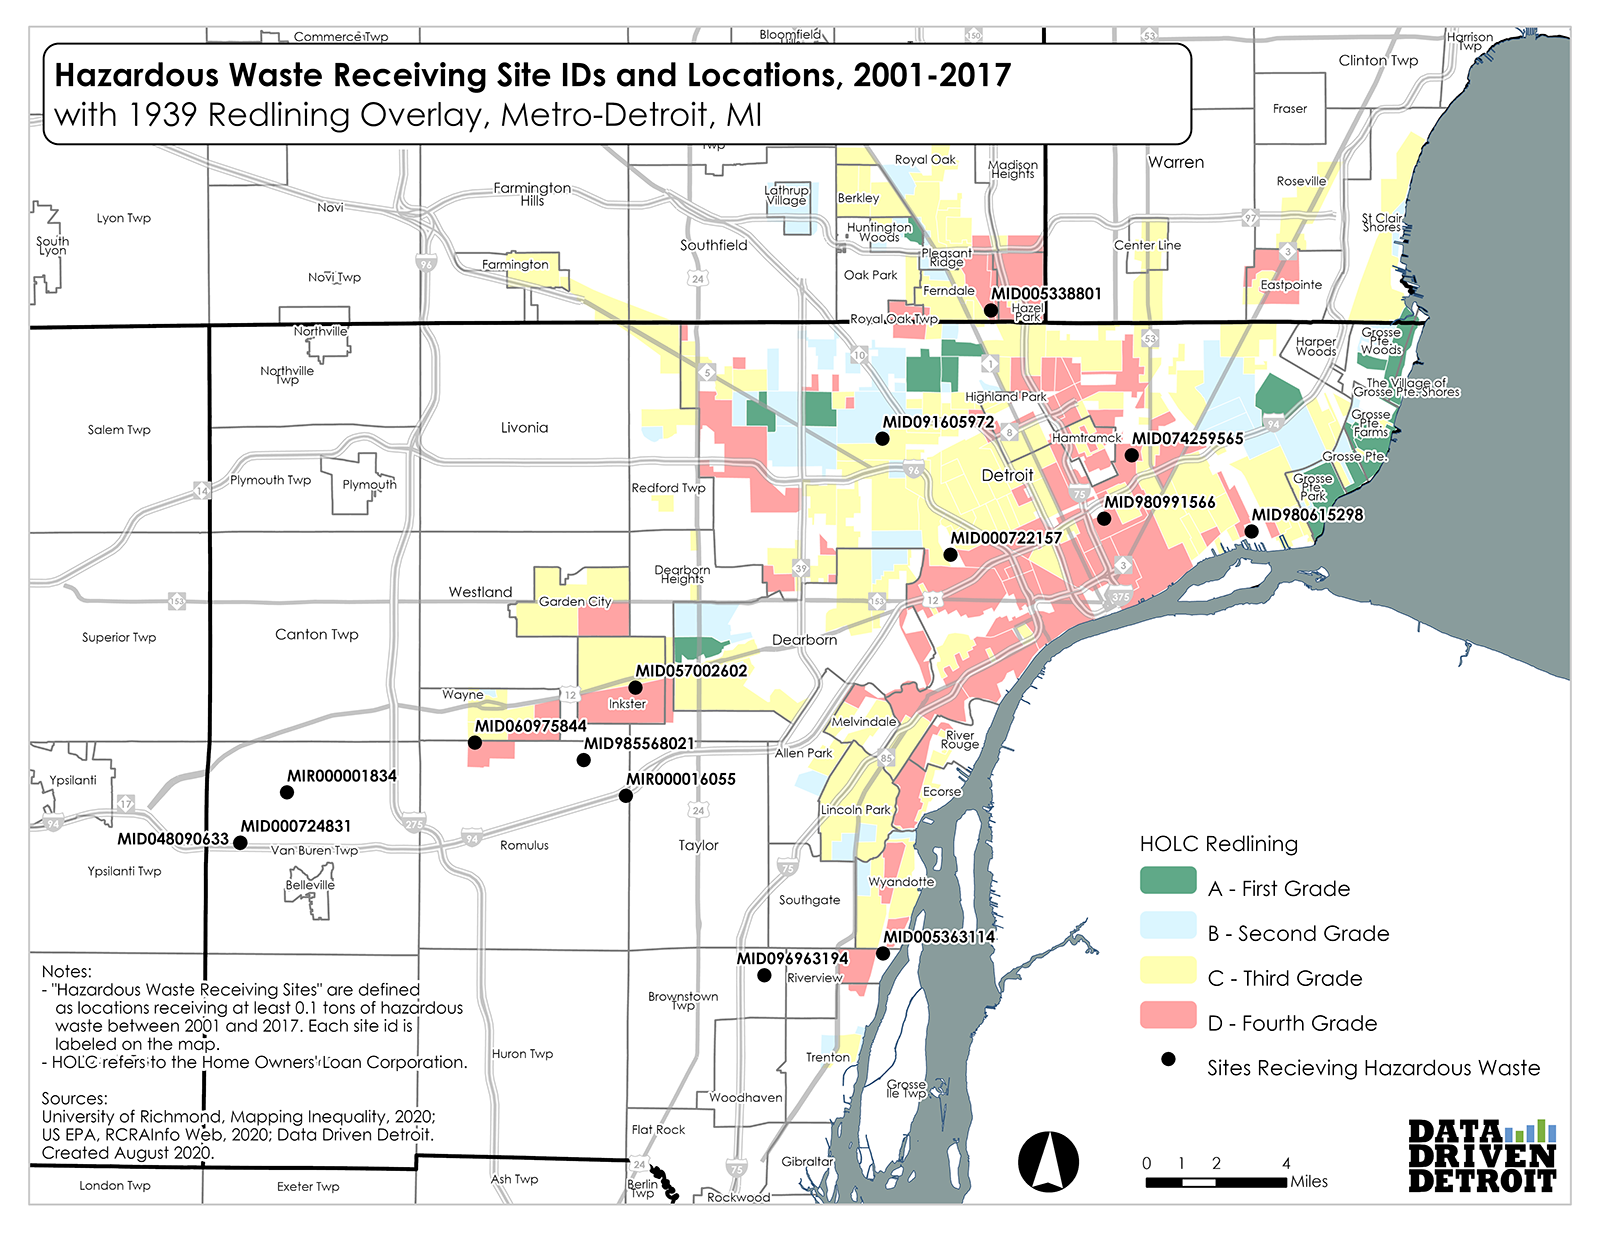
Location maps are useful for helping organizations to work on infrastructure or environmental issues. For example, we received a request in June 2020 for a map of hazardous waste facilities in relation to HOLC redlined areas in Detroit.
Sometimes using multiple maps at a time can help tell a more impactful story. For a June 2020 inquiry of the Curbside Recycling participants in Detroit, we provided a map illustrating the density of participants, as well as a map showing which vendor serviced which area.

Reference Maps
Sometimes, D3 receives requests for very simple maps that can be used to reference a geographic area to accompany data about that area. These maps allow the audience/requester to understand the spatial patterning or reach of various events, phenomenon, or issues. One such inquiry was submitted to us in late February 2020. Per their request, we were able to provide reference maps for three local ZIP codes.

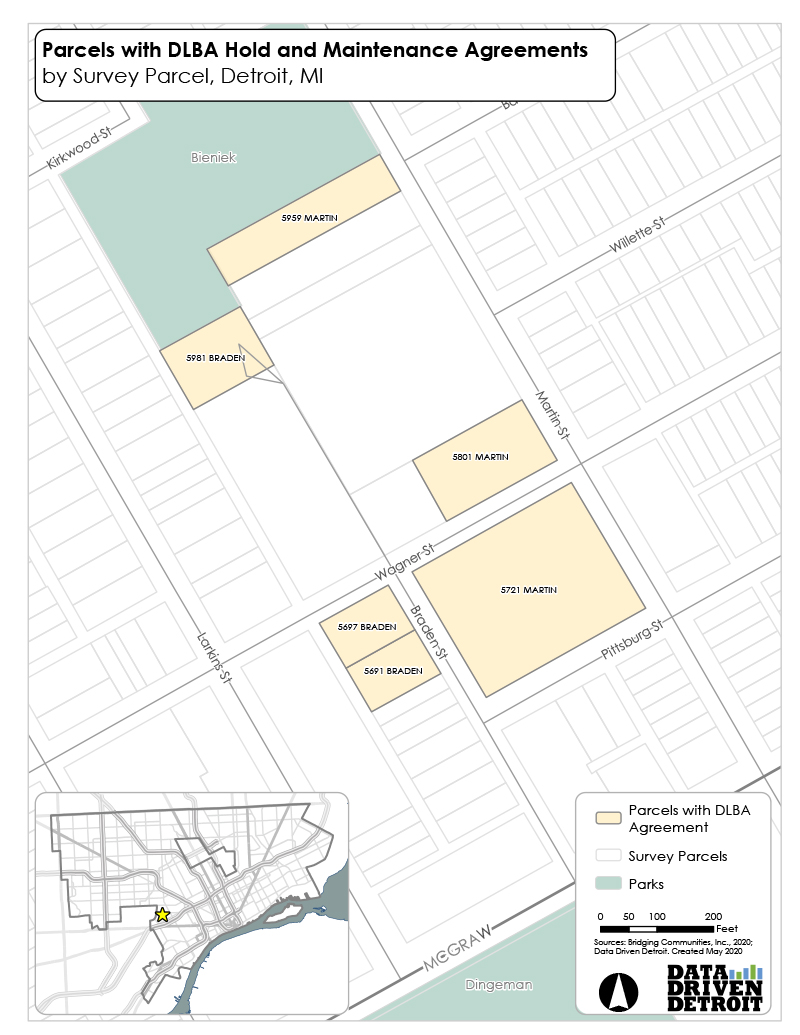
Another simple reference map our team created was in response to a request submitted in May 2020. This map highlights six parcels within a small area of Detroit. No additional data was included in this inquiry, as it was only the spatial data, or exact geographic locations, that were needed for the requester’s purposes.
Do you have any information that you’d like to see on a map, or other data questions? Please reach out to us at AskD3@datadrivendetroit.org or fill out our request form online.
