
Introduction
Centenarians, defined as people age 100 and older, are a tiny but growing age group in Michigan and the United States as a whole(1). In the 2010 U.S. Census, centenarians constituted .0173 percent of the U.S. population and a similar proportion (.0175 percent) of Michigan’s population (1,729 centenarians of the total of 9,883,640 people in Michigan). While they are a small group, studying them can provide insight into healthy aging. In this first blog post, we look at this group not by studying living centenarians but by studying the characteristics of Michigan residents aged 100 or older who died from 2011-2013. We examine the counties in which they lived at the time of death, their educational attainment, and the causes of death, along with several other characteristics. In a second blog post, we will contrast centenarians’ characteristics with those of Michigan residents who died in 2011-2013 at ages 65-69, 70-79, 80-89, and 90-99.
Population of Study
For this study of centenarian deaths we used the Michigan Department of Health and Human Services’ Vital Statistics and Health Records database of deaths in Michigan. In order to have a sufficiently large number of centenarian deaths for analysis we aggregated 2011-2013 death records. For those three years, there were 271,853 deaths of Michigan residents in total. Of that total, 2,414 were deaths of people 100 years old or older (0.89%), or approximately 800 per year. Centenarians’ ages at death ranged from 100 to 114 but were concentrated in the youngest ages. Just over three-quarters (76%) were to people 100-102 years of age with an additional 10% among people 103 years of age.
In analyzing centenarians’ characteristics, we found missing data on some records. For the analysis of a particular characteristic, records with missing data have been eliminated. As a result, the number of records in some of the analyses is fewer than 2,414.
Characteristics of Centenarian Deaths 2011-2013
Geography
Figures 1 and 2 illustrate the distribution of centenarian deaths by Michigan county (Figure 1) and within the tri-county metro Detroit area (Figure 2). On both maps, areas (counties, cities and Detroit City Council districts) with zero or fewer than six centenarian deaths in the three-year period were left blank. On both maps, a darker shading indicates a greater number of deaths.
Figure 1 demonstrates that the greatest number of centenarian deaths in Michigan occurred in mid- and southern Michigan during the three years. Muskegon, Ottawa, and Kent Counties on the western side of the state had relatively high numbers as did Bay, Saginaw, Genesee, Oakland, Macomb, and St. Clair Counties on the more eastern side of the state.; A southern tier of relatively high numbers stretches from Wayne County where Detroit is located to Kalamazoo County in the west.
Five counties in northern Michigan including two in the Upper Peninsula are notable for their comparatively large numbers of centenarian deaths, although the absolute numbers are much smaller than the numbers in the southern part of the state. Of the five, Grand Traverse County had the greatest number, in the range of 36-45. The county adjoining Grand Traverse, Leelanau County, as well as Emmett, Delta, and Houghton Counties each had 16-25 centenarian deaths during the three years.
Figure 1. Centenarian deaths by Michigan county, 2011-2013.

Figure 2 depicts the distribution of centenarian deaths in the tri-county area of metro Detroit. Within the city of Detroit, which is outlined in black, the ranges of deaths are shown by Detroit City Council districts In the portion of Wayne County outside of Detroit and in Oakland and Macomb Counties, the ranges are displayed within city and township boundaries.
The northernmost, westernmost, and southernmost areas of the tri-county area are notable for their few centenarian deaths. In contrast, the largest number of deaths occurred in a swath from Southfield diagonally southeast through Detroit Council Districts 2 and 5 and Clinton Township in Macomb County. Sterling Heights, Warren, and Bloomfield Township had the next highest grouping of deaths.
Figure 2. Centenarian deaths 2011-2013 in the Detroit tri-county area.

Sex and race
Of the 2,414 centenarian deaths in Michigan, 84% (2,022) were female and 16% (388) were male. By race, just 18 were classified as other than Black or White. Of the remainder, 11% were Black (259) and 89% were White (2,137).
Marital status
Table 1. Centenarians’ marital status at time of death, 2011-2013 Michigan deaths.

Few centenarians were never married or divorced at the time of death. Nearly 90% (88%) of the women were widows, with only 5% married. In contrast, 22% of the centenarian males were married, with three-quarters (74%) widowed.
Educational attainment
Table 2. Centenarians’ highest educational attainment at time of death. 2011-2013 Michigan deaths.

Of the centenarians who died during this period, over a quarter (28%) had an 8th grade education or less. Three quarters (74%) had completed their education with high school or less. Thirteen percent had some college or an associate’s degree, and another 13% had a bachelor’s degree or higher.
These numbers for centenarian deaths in 2011-2013 by sex, marital status, and education are in line with the American Community Survey 2007-2011 profile of the centenarian population in the United States, as Table 3 illustrates(2). (All percentages have been rounded to the nearest whole percentage)
Table 3. Sex, marital status, and educational attainment of Michigan centenarian deaths 2011-2013 and the U.S. centenarian population 2007-2011.

Source: Kincel, Brian. “The Centenarian Population: 2007-2011. American Community Briefs, issued April 2014. U.S. Census Bureau
Underlying cause of death
Table 4. Centenarians’ underlying causes of death, 2011-2013 Michigan deaths.
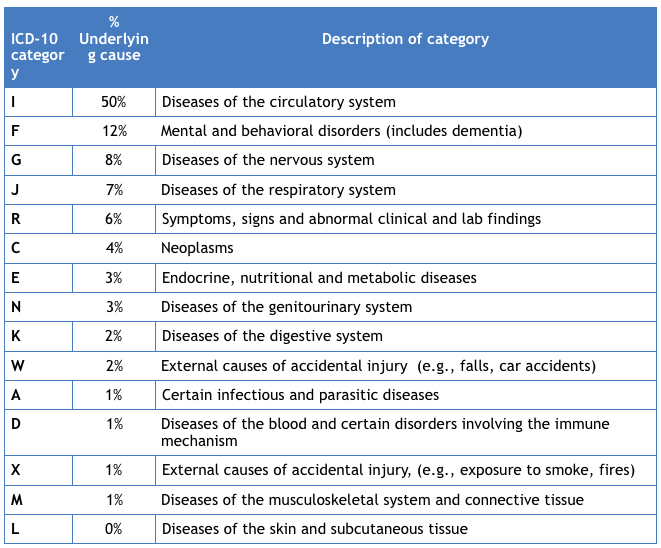
The death certificate also includes codes for the underlying cause of death, using the 10th Revision of the International Classification of Diseases’ codes. Table 4 shows the distribution of underlying causes of death categories for this centenarian population. It vividly illustrates that diseases of the circulatory system dominate the causes in this particular age group, although these trends must be viewed with an underlying skepticism(3). Mental and behavioral disorders are a distant second at 12%.
Summary of findings
This blog post has offered a glimpse of the types of people who died in their 100s in Michigan during 2011-2013. We saw that these centenarians were overwhelmingly female, widowed, and white. Three-quarters had not gone beyond high school in their education, and a little over one-
quarter had completed their education at 8th grade or less. Half were said to have died of circulatory system diseases. Looking at where they lived in the state at the time of their death, we found that generally but not exclusively they lived in the most populated counties.
A second blog post will expand this portrait of centenarians by contrasting characteristics of centenarians who died from 2011-2013 to the characteristics of people who died at younger ages during the same period.
Footnotes
(1) From 1980 to 2010, the percentage of centenarians in the U.S, population grew from 1.42% to 1.73% according to the U.S. Census Bureau official counts. (The Census Bureau cautions that counts of the centenarian population are subject to numerous sources of error) Source: U.S. Census Bureau, 2010 Census Special Reports, Centenarians: 2010, C2010SR-03, U.S. Government Printing Office, Washington, DC, 2012
(2) The ACS 2007-2011 is the most recent 5-year ACS that identified centenarians.
(3) In an enlightening article about the accuracy of death certificate information, Kathryn Schulz wrote, “The Framingham Heart Study, an ongoing longitudinal study in Massachusetts, found that death certificates overstate coronary-heart disease as a cause of death by as much as twenty-four per cent in the general population and by a far greater percentage in the elderly.” Source: Schulz, Kathryn, “Final Forms.” The New Yorker, April 7, 2014.