
by d3wpadmin | Feb 1, 2018 | D3 Data, Stephanie Quesnelle
Temporary Assistance for Needy Families (TANF) is a federally funded block grant. States operate a variety of programs utilizing this funding, but they must fall under one of the four purposes of TANF: Provide assistance to needy families so that children can be cared...

by d3wpadmin | Oct 9, 2017 | D3 Data, Kit Frohardt-Lane
The Issue As part of a project for Forgotten Harvest, a Detroit area food bank, Data Driven Detroit was asked to construct a single measure that would quantify food insecurity levels by census tract in the tri-county area of southeast Michigan (Wayne, Oakland, and...

by d3wpadmin | Jun 20, 2017 | D3 Data, Stephanie Quesnelle
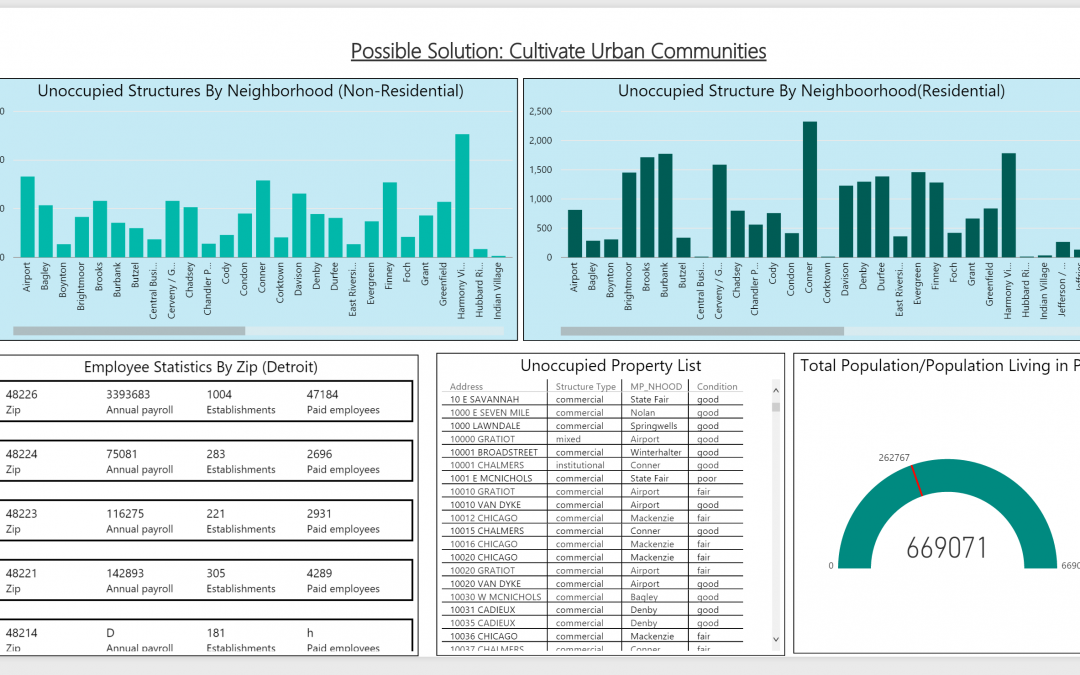
What do all of these numbers have in common? They’ve been used in the past year to describe the vacancy rate in Detroit. Some represent different parts of the city others represent different types of building (residential vs. commercial), types of tenants (renters vs....

by d3wpadmin | Dec 9, 2016 | D3 Data, Kit Frohardt-Lane
Introduction Centenarians, defined as people age 100 and older, are a tiny but growing age group in Michigan and the United States as a whole(1). In the 2010 U.S. Census, centenarians constituted .0173 percent of the U.S. population and a similar proportion (.0175...
by d3wpadmin | Aug 29, 2016 | D3 Data, Ivoire Morrell
This is the third and concluding section to the three-part series of Detroit Crime statistics, causes and potential solutions. Microsoft’s Civic Tech Fellow Ivoire Morrell shares a powerful story of the history, economic impact and future narratives of Detroit’s most...

by d3wpadmin | Aug 17, 2016 | D3 Data, Ivoire Morrell
17 APRIL, 2016 Hello Detroiters, and a big how-are-you to our CUTGroup family. Unfortunately this is our last story in our recruitment journey this summer. So walk with us on this final trip as we ventured into the second half of Downtown Detroit to recruit for...
